Distributions
Any unfamiliar word is in the glossary.
Every duration in a model is a distribution: how long a step takes, the gap between arrivals, time to repair, how long a break lasts. They all share one shape.
kind: exponential
mean: 120.0
kind selects the family and the remaining keys are its parameters. All values are
seconds unless the field says otherwise.
The seven kinds, drawn
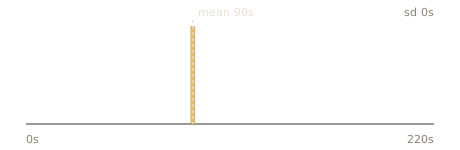
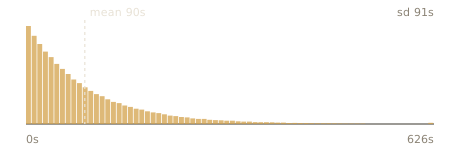
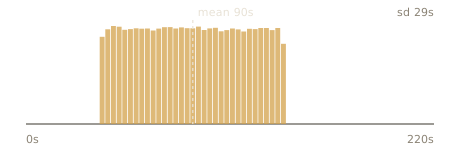
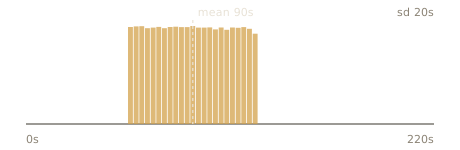
Every picture below is a histogram of 200,000 draws taken the way the engine takes them, and every one has the same mean of 90 seconds. What differs is the spread — and the spread is the whole reason to run a simulation.
constant
kind: constant
value: 90
Always the same. A repeatable machine cycle. Zero is legal for a process time and means an instantaneous step; zero is not legal as an interarrival time.
exponential
kind: exponential
mean: 90.0
Memoryless: most draws are short, a few are very long. The default choice for arrivals and for unplanned failures. Note the tail — it runs well past three times the mean.
uniform
kind: uniform
lo: 40.0
hi: 140.0
Flat between the bounds. Honest when all you know is a range.
uniform_offset
kind: uniform_offset
mean: 90.0
offset: 35.0
The same shape written as a centre and a half-width, which is how SMT2020 and several other
datasets express it. mean - offset may not go below zero.
triangular
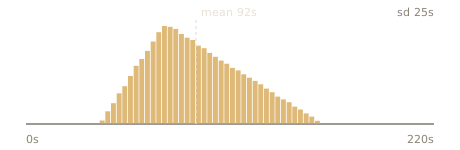
kind: triangular
lo: 40.0
mode: 75.0
hi: 160.0
Peaked at mode. Use it when somebody can give you a best case, a worst case and a usual
case — which is most of the time, on a shop floor.
normal
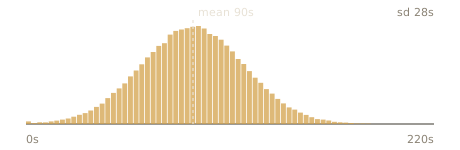
kind: normal
mean: 90.0
sd: 28.0
rectify: true
That is rectify: true clamping at zero. Without it the distribution would produce negative
durations, and validate refuses the model when mass falls below zero rather than letting a step
take minus four seconds. It is an error, not a warning: cwright validate exits 1.
erlang
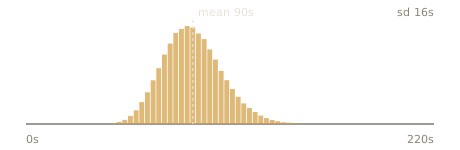
Three k values, same mean. k is how repeatable the thing is.
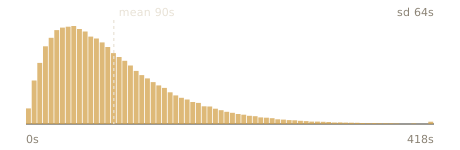
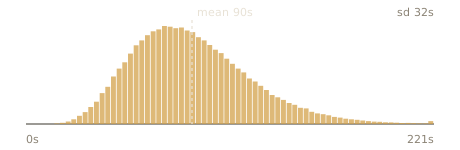
kind: erlang
k: 2
mean: 90.0
kind: erlang
k: 8
mean: 90.0
kind: erlang
k: 32
mean: 90.0
At k = 1 an Erlang is an exponential. As k rises it tightens towards a constant, which
makes it the natural way to say "repeatable, but not perfectly so".
Same mean, different plant
Measured from the draws above:
| kind | mean | sd | cv | queue, relative to exponential |
|---|---|---|---|---|
constant | 90.0 s | 0.0 s | 0.000 | 0.50× |
erlang k=32 | 90.0 s | 15.9 s | 0.177 | 0.52× |
uniform_offset | 90.0 s | 20.2 s | 0.225 | 0.53× |
triangular | 91.6 s | 25.2 s | 0.276 | 0.54× |
normal | 90.0 s | 28.0 s | 0.311 | 0.55× |
uniform | 89.9 s | 28.9 s | 0.321 | 0.55× |
erlang k=8 | 89.9 s | 31.8 s | 0.354 | 0.56× |
erlang k=2 | 90.0 s | 64.1 s | 0.712 | 0.75× |
exponential | 90.1 s | 90.7 s | 1.007 | 1.00× |
Every row has the same average. A capacity sheet cannot tell them apart, because a capacity sheet only knows the mean. The queue in front of the machine differs by a factor of two between the top row and the bottom one, at identical load.
The last column is (1 + cv²) / 2, the Pollaczek–Khinchine result for a single server: the
queue scales with the square of the coefficient of variation. Replacing a spread with its
mean does not make a model simpler, it makes the model wrong in the optimistic direction.
Choosing one
- A machine that repeats —
constant, orerlangwith a highk. A cell like this queues about half of what a memoryless model predicts, which is why assuming exponential "to be safe" can talk you into capacity you do not need. - Unplanned events — failures and repairs are usually
exponential. - "Best, worst, usually" —
triangular. - Arrivals you do not control —
exponential. Arrivals on a drumbeat —constant.
Every key
| value | means |
|---|---|
"constant" | Always the same value. value is in the unit of the field it sits in, usually seconds. |
"exponential" | Memoryless, with the given mean. The usual choice for unplanned events and for arrivals. |
"uniform" | Flat between lo and hi inclusive. |
"uniform_offset" | The SMT2020 spelling: a mean with a symmetric offset. |
"triangular" | Peaked at mode, bounded by lo and hi. Useful when somebody can say a best, worst and likely case. |
"normal" | Gaussian with mean and sd. Set rectify: true to clamp at zero, or validate will refuse the model. Defaults to false. |
"erlang" | A sum of k exponentials with total mean. Less variable than exponential; k is the shape. |
| kind | keys | constraints |
|---|---|---|
constant | value | ≥ 0 |
exponential | mean | > 0 |
uniform | lo, hi | 0 ≤ lo ≤ hi |
uniform_offset | mean, offset | offset ≥ 0, mean - offset ≥ 0 |
triangular | lo, mode, hi | lo ≤ mode ≤ hi, lo < hi |
normal | mean, sd, rectify | sd ≥ 0 |
erlang | k, mean | k ≥ 1, mean > 0 |
scripts/gen-distribution-plots.py draws them from 200,000 samples with a fixed seed, so
rerunning it produces byte-identical files and any diff means something really changed.